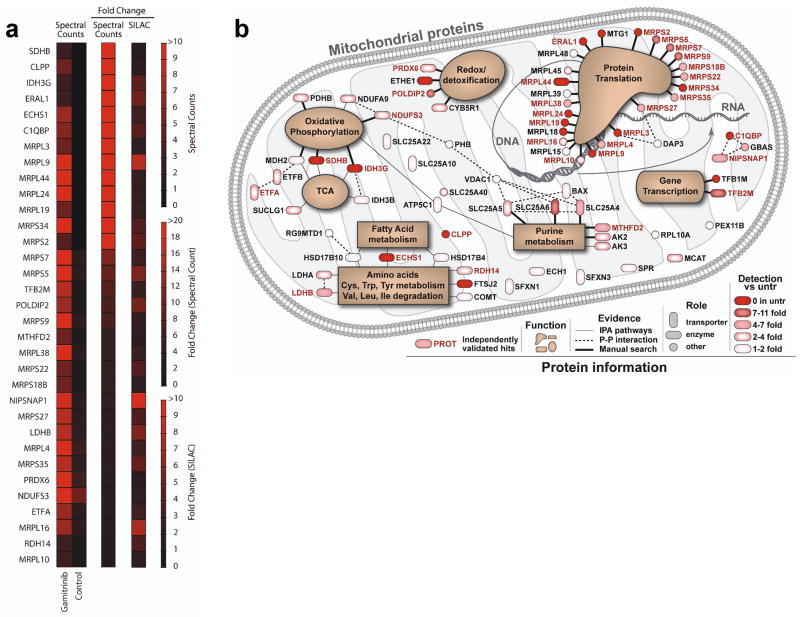
Figure 1. Mitochondrial Hsp90 proteome.
(a) LN229 cells were treated with vehicle (Control) or non-cytotoxic concentrations of mitochondrial-targeted Hsp90 inhibitor, Gamitrinib, and detergent-insoluble mitochondrial proteins were identified by 1-D Mass Spectrometry (spectral counts), or, alternatively, by SILAC technology. The heat map quantifies changes in protein solubility (>3-fold cutoff) between the treatments assessed using the two independent proteomics approaches. (b) Schematic representation of the mitochondrial Hsp90 proteome. Proteins are annotated with functions based on literature search and information from Ingenuity software, which was also used to determine known direct protein-protein interactions. All proteins are color coded to reflect the magnitude of difference in detection between treated and untreated (untr) samples. Proteins marked in ‘red’ exhibited a >3-fold change difference after Gamitrinib treatment compared to control, and were independently confirmed by both 1-D Mass Spectrometry and SILAC technology.

