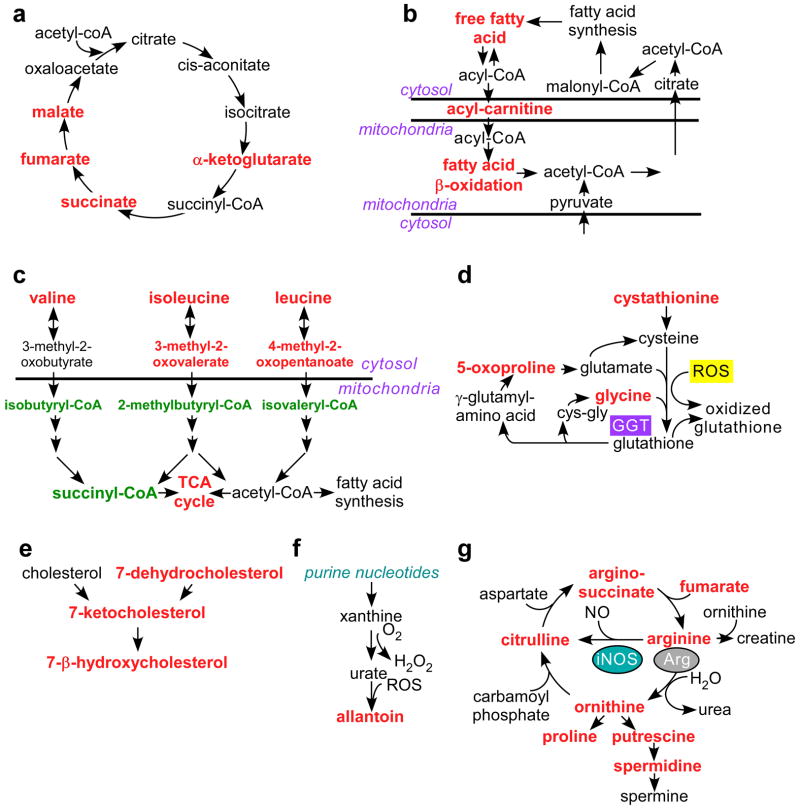
Figure 2. Mitochondrial Hsp90 control of tumor cell metabolism.
PC3 cells were transfected with control non-targeting siRNA or TRAP-1-directed siRNA, or, alternatively, treated with non-cytotoxic concentrations of 17-AAG (5 μM) or Gamitrinib (2.5–5 μM), and analyzed for changes in expression of 301 individual metabolites by Mass Spectrometry. The complete summary of metabolic changes induced by targeting mitochondrial Hsp90s is presented in Supplementary Data 2. The experiment was carried out once with 5 independent replicates per condition tested. The metabolic pathways affected under these conditions are depicted as follows: (a) Citric acid cycle; (b) Fatty acid oxidation; (c) Branched chain amino acid catabolism; (d) Redox status; (e) Cholesterol metabolism; (f) Purine nucleotide metabolism; and (g) Arginine metabolism. Significant (p<0.05) changes in metabolite levels within each group (Ctrl vs. TRAP-1 siRNA or vehicle vs. Gamitrinib) are indicated in red (increase) or green (decrease) using Welch’s two-sample t-test (n=5).

