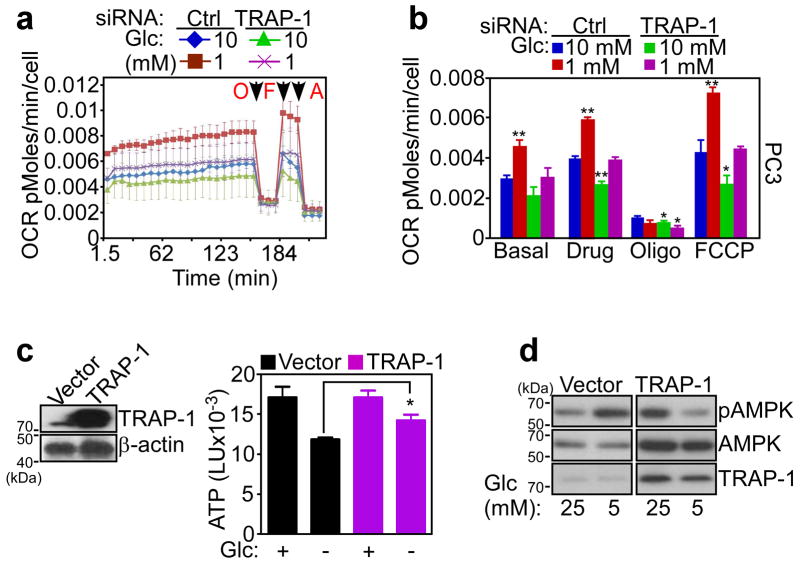
Figure 4. Mitochondrial Hsp90 regulation of stress bioenergetics.
(a) PC3 cells were transfected with control, non-targeting siRNA (Ctrl) or TRAP-1-directed siRNA and maintained in 1 or 10 mM glucose (Glc) for 3 h before analysis of OCR. Arrows indicate the time of drug addition: O, oligomicyin (1.25 μM); F, FCCP (0.4 μM); A, antimycin (1.8 μM). (b) OCR in a was quantified in siRNA-transfected cells in different glucose (Glc) concentrations. Data for panels (a, b) data are representative of two independent experiments carried out in triplicate, mean±sd. * p<0.05; ** p<0.01 vs control sample at each state (two-sided unpaired t test). (c) Normal NIH3T3 fibroblasts were transfected with control vector or TRAP-1 cDNA and analyzed by Western blotting (left) or ATP production in the presence (+) or absence (−) of glucose (Glc, 25 mM) (right). *, p=0.03 (two-sided unpaired t test). (d) NIH3T3 fibroblasts were transfected as in (c), incubated with the indicated concentrations of glucose (Glc, mM), and analyzed by Western blotting. p, phosphorylated.

