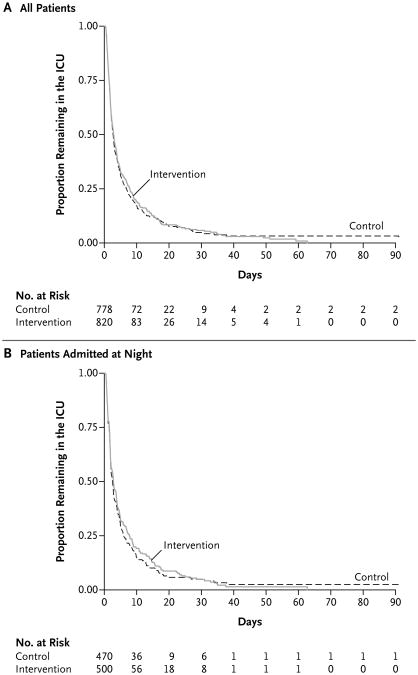
Figure 2. Kaplan–Meier Curves for Time to Discharge from the ICU.
The time to discharge from the ICU is shown for all the patients (Panel A) and for only patients who were admitted to the ICU at night (Panel B), according to whether they were admitted to the ICU on a night with in-house intensivist staffing (intervention) or on a night with traditional nighttime coverage by residents (with daytime intensivists available for consultation by telephone) (control).

