Figure 4.
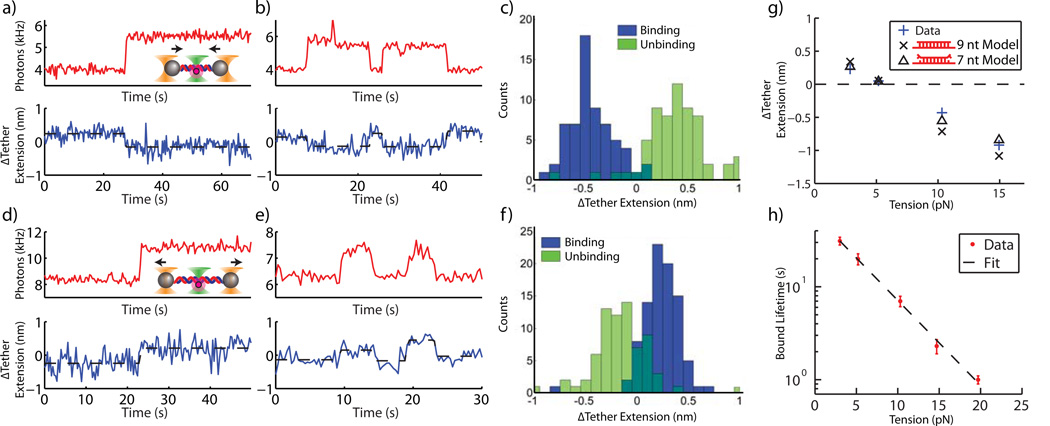
Combined measurement of fluorescence and DNA tether extension. (a) – (b) and (d) – (e) Fluorescence (red, 333 ms per data point) and DNA tether extension (blue, acquired at 66 kHz, boxcar averaged to 3 Hz) are measured simultaneously. The binding (unbinding) of probe strands is indicated by stepwise increases (decreases) in fluorescence and is coincident with angstrom-level stepwise changes in DNA tether extension. (c) and (f) Change in tether extension for many binding and unbinding events for 10 pN (c) and 3 pN (f) tensions. (g) Mean change in tether extension upon binding and unbinding vs. tether tension. Data points at ~3, 5 and 10 pN include only binding events (avoiding confusing unbinding with photobleaching). ~15 pN data point includes only unbinding events (photobleaching does not occur given short bound probe lifetime and insufficient counts of binding were obtained since acquisition was made using a “Wait-and-Yank” technique, see Methods). Standard error bars are smaller than symbol sizes (n = 90, 114, 63, 19, and 14 for 3, 5, 10, 17, and 20 pN respectively). Measurements in (g) and (h) at 3, 5, 10, 17, and 20 pN, are derived from 71, 35, 20, 17, and 16 unique tether molecules respectively. Models assume 9 nt or 7 nt (best fit to data) of the 9 nt probe strand stably bind to the tethered DNA. (h) Semilog plot of duplex lifetime vs. tension (s.e.m, n = 156, 68, 52, 35, and 34 for 3, 5, 10, 17, and 20 pN respectively). Dashed line is linear fit. ~15 and 20 pN data in (g) and (h) acquired with Wait-and-Yank technique.

