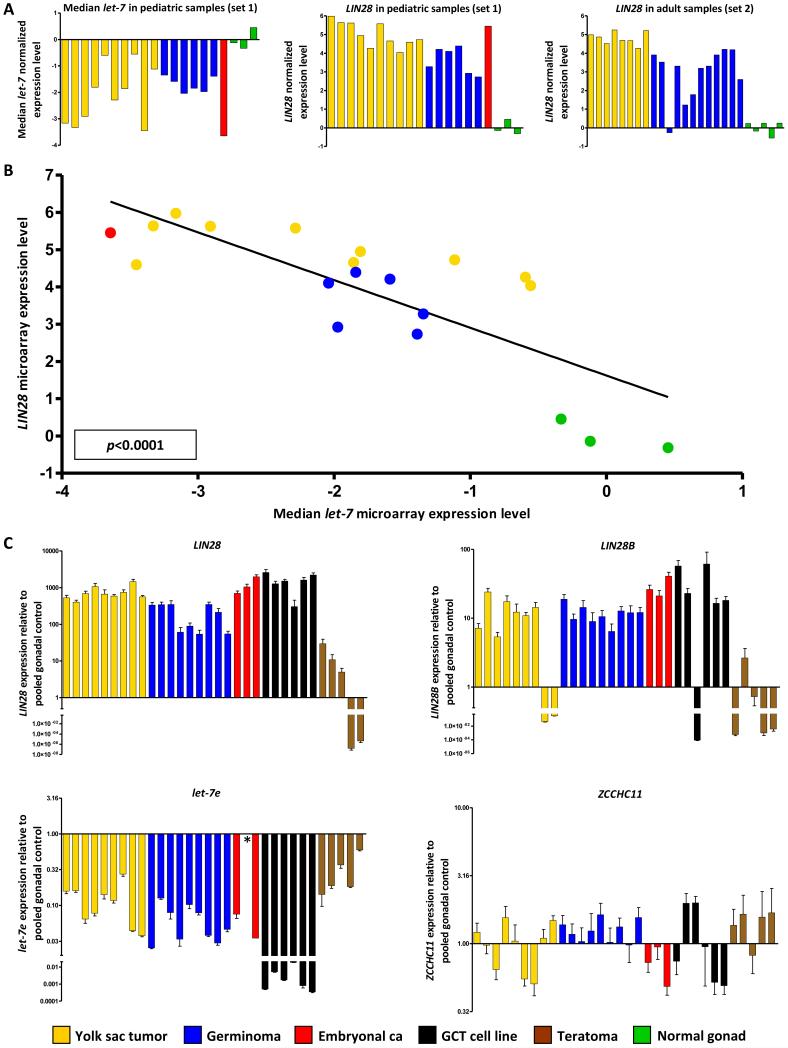
Figure-1. Let-7 and LIN28 expression in malignant-GCTs.
A) The left and middle panels respectively show median levels of all nine let-7 family members and levels of LIN28 in the 20 samples from set-1 with matching microRNA and mRNA data. The right panel shows levels of LIN28 in sample set-2. B) Linear-regression analysis of median let-7 family levels versus LIN28 levels in the set-1 samples with matching data. In A) and B), all values are referenced to the mean of the normal gonadal samples. C) qRT-PCR validation in sample set-3, referenced to the pooled normal gonadal control sample. Error-bars= standard error of the mean (SEM). For one sample (asterisked) there was insufficient RNA for let-7e quantification. The color-code for all panels is shown in the key. For details of the normal gonadal controls, see Materials and Methods.

