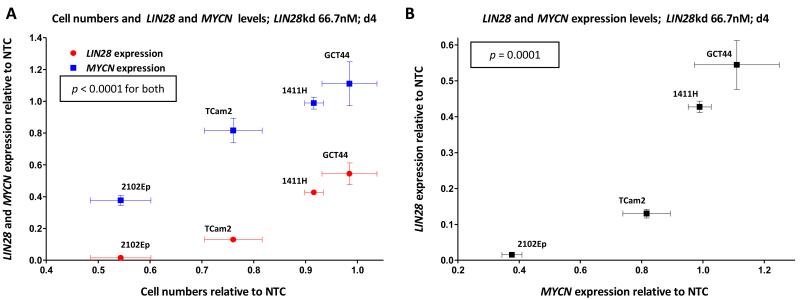
Figure-4. Correlations between LIN28, MYCN and cell numbers following LIN28 depletion.
The graphs show data for all four malignant-GCT cell-lines at d4 following LIN28 depletion, compared with NTC-treated cells. Panel A shows cell numbers versus the levels of LIN28 (red) and MYCN (blue), while panel B shows levels of MYCN versus LIN28. NTC=non-targeting-control siRNA, kd=knockdown. Correlation p-values were determined by linear-regression. Error-bars=SEM.

