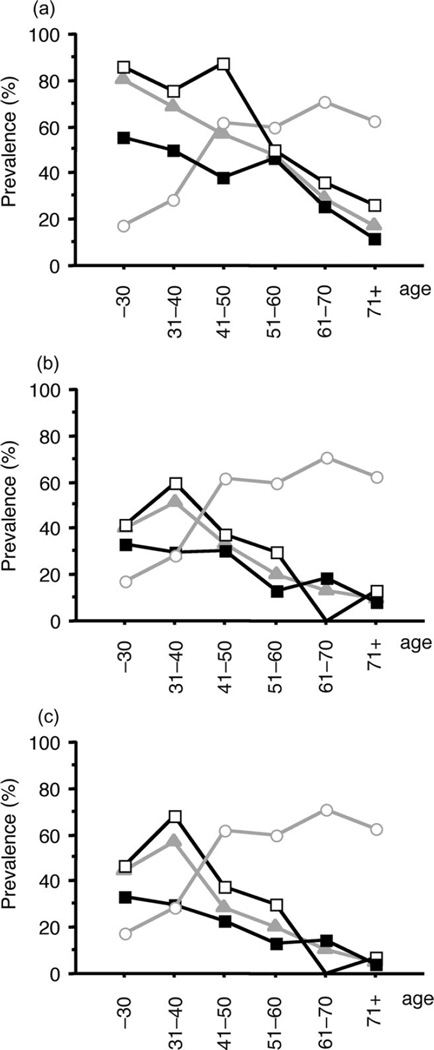
Figure 2.
Helicobacter pylori (H. pylori) infection rate and specific immunoglobulin E (IgE)-positive rate for pollen (a), mites (b), and house dust (c) in different age-dependent groups. H. pylori infection rate increased according to age, whereas the specific IgE-positive rate decreased. (○) H. pylori-positive patients; (▲) specific IgE positivity; (■) specific IgE positivity, and H. pylori-positive patients; (□) specific IgE positivity, and H. pylori-negative patients.

