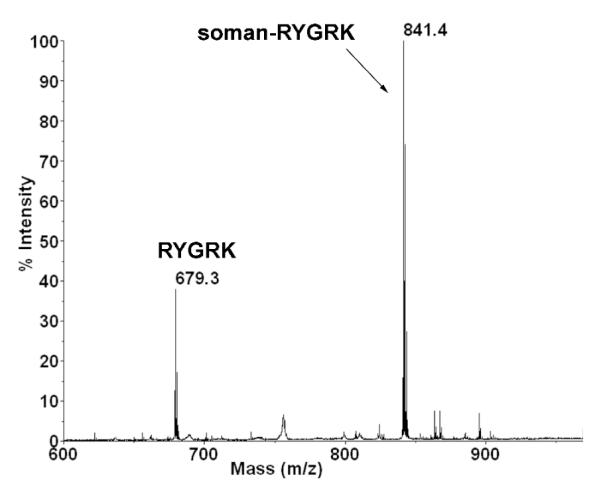
Figure 1.

MS spectrum showing relative abundance of unlabeled RYGRK and soman-RYGRK. A reaction mixture of 1.47 mM RYGRK and 14.7 mM soman in 100 mM ammonium bicarbonate was diluted 1:100 before spotting 0.5 μl on a MALDI plate with alpha-cyano-4-hydroxycinnamic acid matrix. The peak at m/z 679.3 is unlabeled peptide RYGRK. The peak at m/z 841.4 is soman-labeled RYGRK. Calculation of cluster areas showed that 75% of the peptide solution was soman-labeled.
