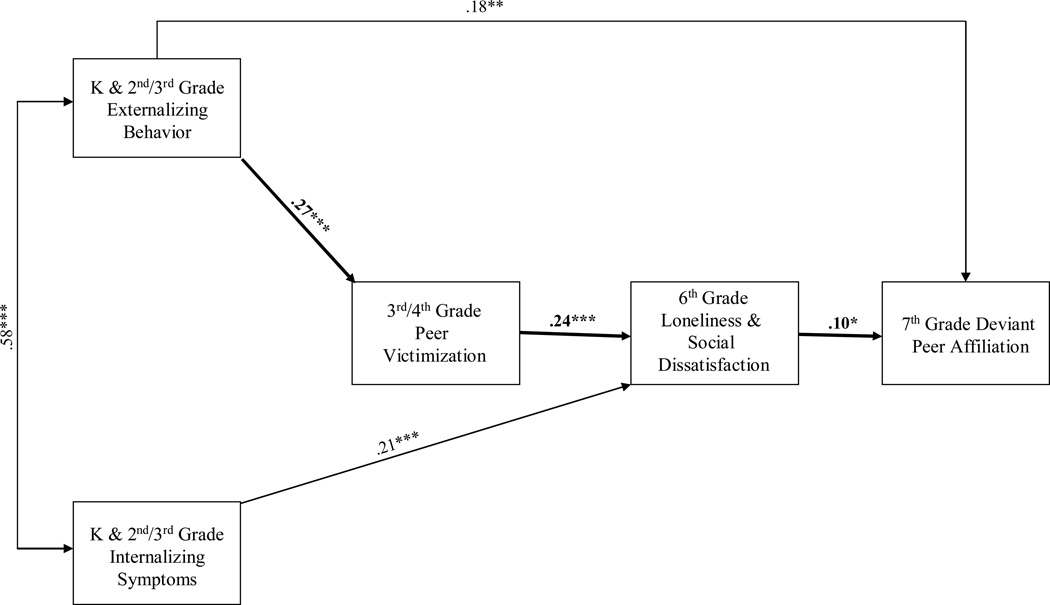
Figure 1.
Path model results with standardized coefficients for Study 1. *p < .05. **p < .01. ***p < .001. Bolded paths reflect components of the hypothesized pathway. Not displayed are nonsignificant paths and paths between both gender and ethnicity and each of the variables in the model. Of those paths, the following were significant: gender to DPA (β = −.13**); ethnicity to victimization (β = −.11*).

