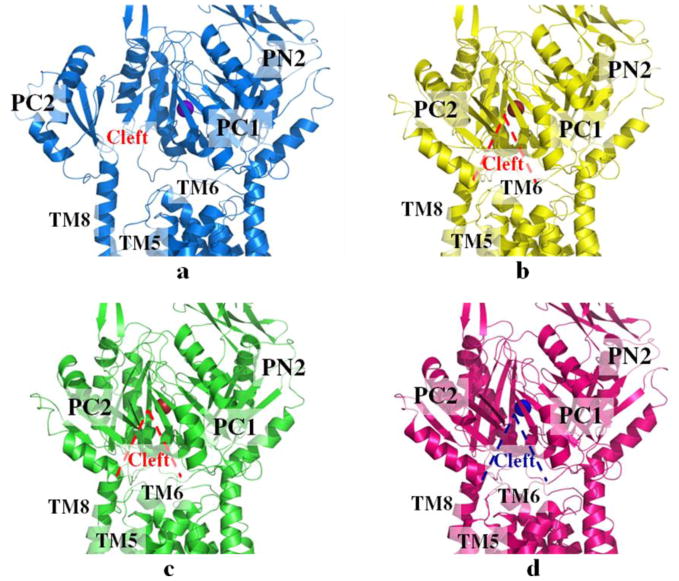
Figure 6.
Structures of the CusBA-Cu(I) efflux complexes. (a) Ribbon diagram of the structure of form Ia (blue) viewed in the membrane plane. The bound copper is shown as a purple sphere. This structure represents the “pre-extrusion 1” state of the pump. (b) Ribbon diagram of the structure of form Ib (yellow) viewed in the membrane plane. The bound copper is shown as a red sphere. This structure represents the “pre-extrusion 2” state of the pump. (c) Ribbon diagram of the structure of form II (green) viewed in the membrane plane. The bound copper is shown as a red sphere. This structure represents the “pre-extrusion 2” state of the pump. (d) Ribbon diagram of the structure of form III (magenta) viewed in the membrane plane. The bound copper is shown as a blue sphere. This structure represents the “extrusion” state of the pump. For clarity, only the periplasmic domain (subdomains PN2, PC1 and PC2) and part of the transmembrane region of CusA are shown in (a)–(d). The molecules of CusB in each complex are not included.

