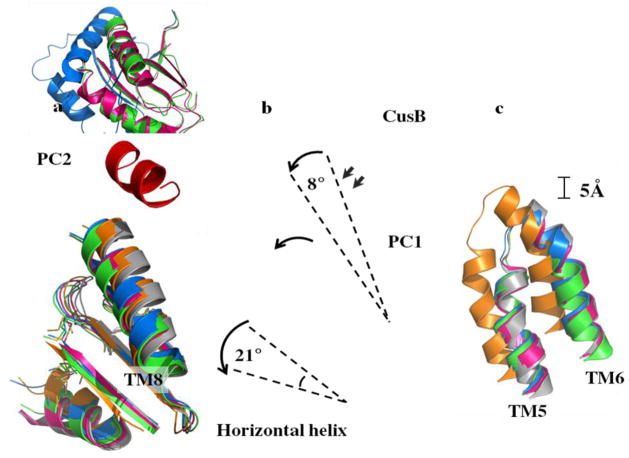
Figure 7.
Different conformational states of CusBA-Cu(I). (a) Superimposition of subdomain PC2 and TM8 of each state of the pump. The arrow indicates a 30° swing of PC2 upon conformational transition from the “pre-extrusion 1” (cyan) to “pre-extrusion 2” (green) and “extrusion” (magenta) states. The structures of forms Ia, II and III are used to represent the “pre-extrusion 1”, “pre-extrusion 2” and “extrusion” states, respectively. (b) Superimposition of subdomain PC1 and the horizontal helix of each state of the pump. The figure illustrates the change in conformations of the PC1 helix (residues 582–589) and the flexible loop (residues 609–626) upon CusB binding. For clarity, only the short C-terminal helix (residues 391–400) of molecule 1 of CusB (red) is included. The change in conformation of the horizontal helix at different states of the pump is also shown in this superimposition (apo-CusBA, gray; CusA-Cu(I), orange; form Ia, cyan; form II, green; form III, magenta). (c) Superimposition of the transmembrane helices 5 (TM5) and 6 (TM6) of each state of the pump. The figure illustrates the change in positions of TM5 and TM6 (residues 447–495) within the transport cycle (apo-CusBA, gray; CusA-Cu(I), orange; form Ia, cyan; form II, green; form III, magenta). As both forms Ib and II are in the same state, the conformation of form Ib is not included in (a)–(c) for clarity.

