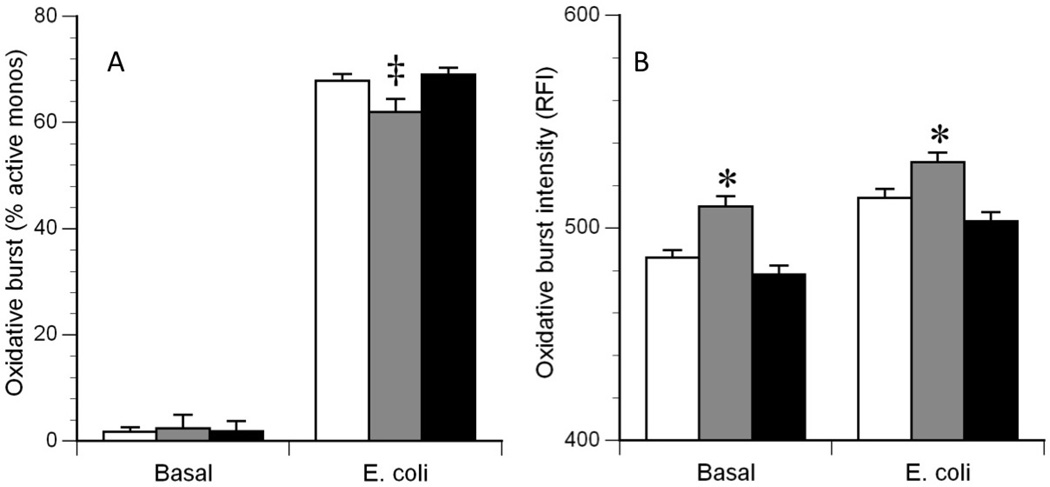
Figure 2.
Oxidative burst characteristics of monocytes. The left panel (A) illustrates the percentage of monocytes actively producing an oxidative burst in the Basal (non-stimulated) condition and in the E. coli (stimulated) condition. The right panel (B) illustrates the average burst intensity of the active monocytes in each condition. White bars: healthy control (HC) subjects; Gray bars: Down syndrome (DS) subjects; Black bars: Mentally disabled (MR) subjects. ‡: DS < HC and MR, P = 0.01;
*: DS > HC and MR, P < 0.001.

