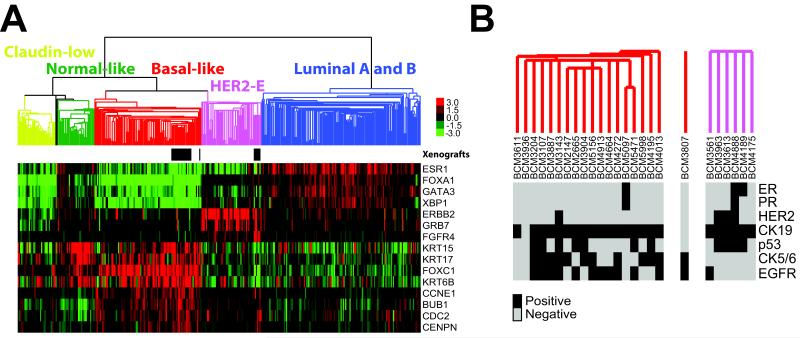
Figure 4. Global gene expression analyses of the BCM xenografts combined with 337 breast samples of the UNC337 breast cancer dataset.
(A) Semi-unsupervised hierarchical clustering of 31 BCM xenografts and 337 breast samples using the 1900 intrinsic list [25, 26]. Localization of the BCM xenografts is shown by the black rectangles below the array tree. Expression of selected genes is shown in the heatmap. Each colored square represents the relative transcript abundance (in log2 space) for each sample with highest expression being red, average expression being black and lowest expression being green. (B) Detailed clusters of the BCM xenografts (one line per patient depicted) with the biomarker expression of each sample. Estrogen receptor (ER), progesterone receptor (PR), HER2, cytokeratin 19 (CK19), cytokeratin 5/6 (CK5/6) and EGFR.

