
Fig. 3.
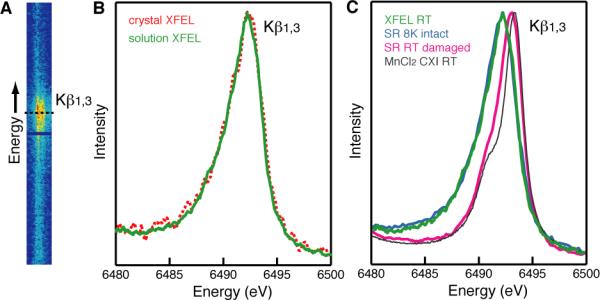
Femtosecond XES of PS II. (A) The 2D Kβ1,3 X-ray emission spectra from microcrystals of PS II collected with a position sensitive detector at the CXI instrument using sub 50 fs pulses of about 2-3×10¹¹ photons/(pulse μm2). (B) X-ray emission spectra of a solution of PS II (green) and single crystals of PS II (red dashed) in the dark state, both collected at the CXI instrument, obtained from the 2D plot in panel (A) by integration along the horizontal axis. (C) X-ray emission spectra of PS II solutions in the dark state collected at the CXI instrument at RT (green) or collected using SR under cryogenic conditions with low dose (“8K intact”, light blue) and using SR at RT under photo-reducing conditions (“RT damaged”, pink). The spectrum from MnIICl2 in aqueous solution collected at RT at the CXI instrument is shown (grey) for comparison.