
Figure 11.
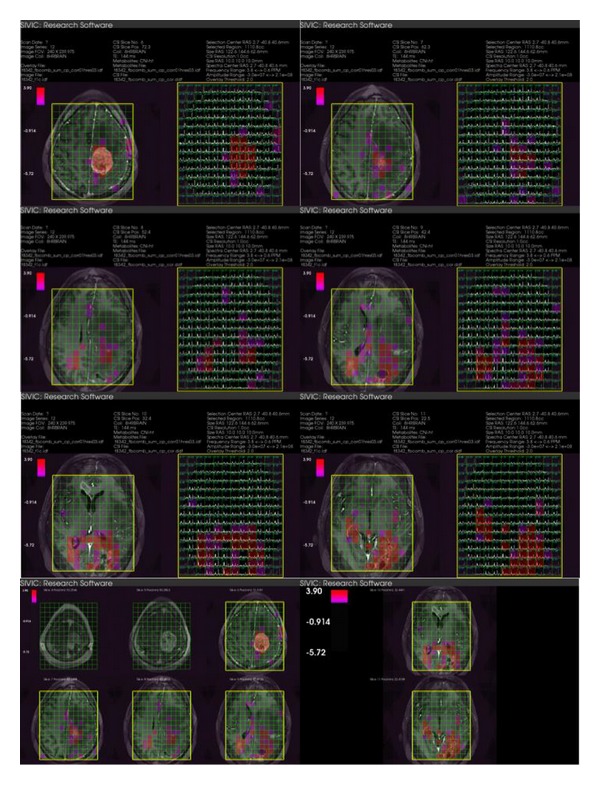
SIVIC generated DICOM secondary capture report for UCSF MRS exam. The series consists of 8 images shown here. The color overlay represents the choline to NAA index. Spatial referencing to T1 postcontrast image, volume localization (yellow), and sat bands (purple shading) are shown. The final two images are summary representations of the acquisition referenced to the anatomical images.