
Figure 9.
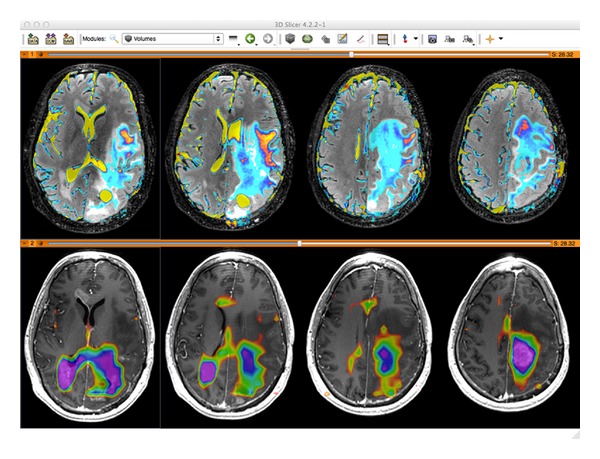
CNI metabolite maps (bottom color overlay) derived from MRSI data in SIVIC are exported as standard DICOM MR Image Storage SOP instances, which can be loaded into 3D DICOM image analysis software packages (shown here in 3D Slicer). Derived maps are thus amenable to multimodal analysis. The top panel shows ADC maps (color) on FLAIR images. The bottom panel shows the same anatomical locations on a T1 contrast enhanced image.