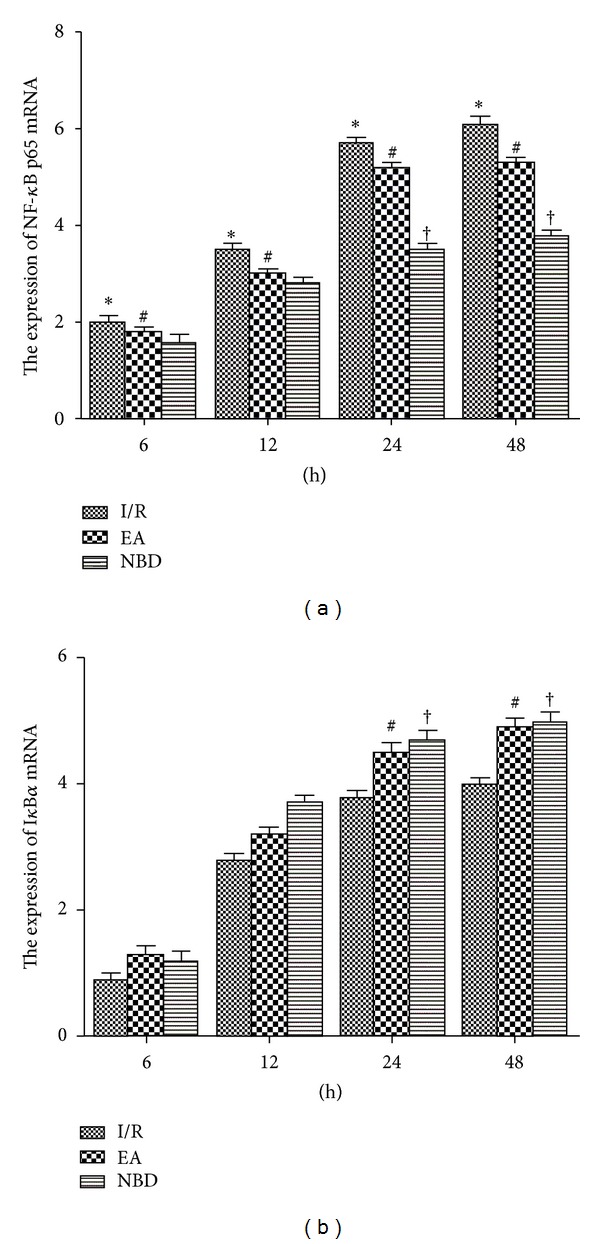
Figure 6.

Fluorescent Quantitative-PCR analysis of the NF-κB p65 and IκBα mRNA expression of the sham group, I/R group, EA group, and NBD group in the ischemic brain tissue (5 rats in each group per time point, total 80 rats). (a) The expression of NF-κB p65 mRNA was significantly increased in the I/R group compared with that in the EA and NBD groups, *P < 0.05. At 24 h and 48 h, the NF-κB p65 mRNA in the EA group was higher, # P < 0.05, † P < 0.05 versus NBD group. (b) The IκBα mRNA expression in EA group and NBD group was higher, # P < 0.05, † P < 0.05 versus I/R group.
