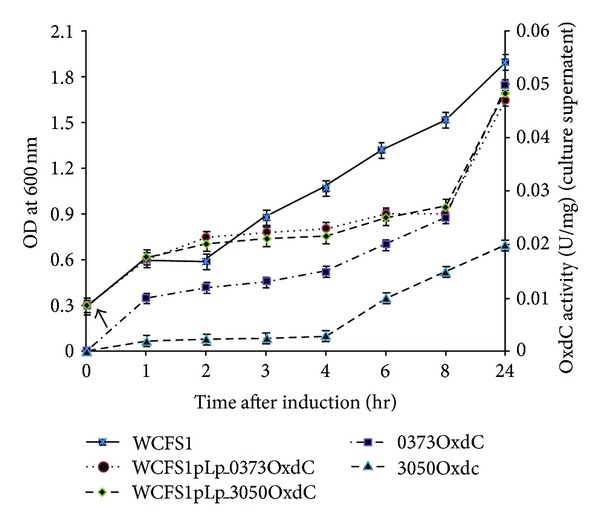
Figure 3.

Growth curve analysis and OxdC activity in culture supernatant of different recombinants L. plantarum construct against nonrecombinant L. plantarum after induction (arrow indicates the induction point at OD600 ~ 0.3). The represented data are mean value of three independent experiments; 0373OxdC (solid square) and 3050OxdC (solid triangles) indicates the enzymatic activity of OxdC in culture supernatant during corresponding growth time OD600 ~ 0.5 (1st hr) late exponential growth OD600 ~ 1 (6th hr) and late logarithmic phase OD600 ~ 1.7 (24th hr) of recombinant strains WCFS1pLp_0373OxdC, WCFS1pLp_3050OxdC, respectively, and WCFS1 indicates the wild type strain of L. plantarum.
