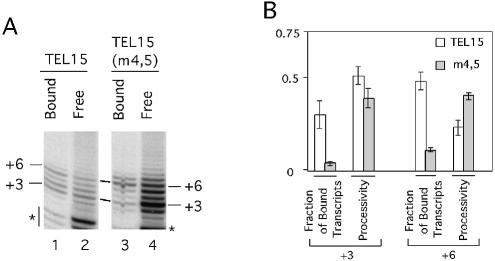
Figure 4.
Analysis of the stability of telomerase–DNA complexes. (A) Primer extension assays were performed using either TEL15 (lanes 1 and 2) or TEL15(m4,5) (lanes 3 and 4) and telomerase that was bound to IgG-Sepharose. The assays also include 0.2 µM dGTP and 50 µM dTTP. Following the reaction, the IgG-Sepharose was washed three times with 150 µl each of TMG-10(150). Both the Sepharose fraction (Bound; lanes 1 and 3) and the combined washes (Free; lanes 2 and 4) were analyzed for the presence of labeled products. The positions of the P + 3 and P + 6 products are indicated at both sides of the panels. Some low molecular weight RNase-insensitive products (indicated by asterisks) can be observed in this set of assays. (B) The fraction of enzyme-bound product and enzyme processivity at the P + 3 and P + 6 position for TEL15 and TEL15(m4,5) are determined in duplicate assays and the averages and deviations plotted for comparison. Enzyme processivity at the P + 3 and P + 6 position was determined by assuming that the amount of reverse transcript at each position was the sum of the bound and free product, and by using the formula described in Materials and Methods.

