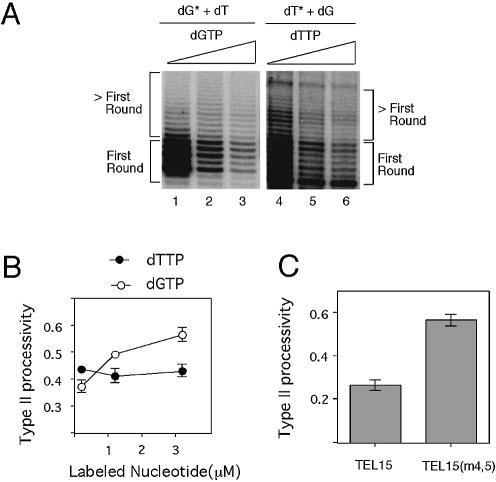
Figure 6.
Analysis of type II translocation efficiency. (A) Primer extension assays were performed using TEL15(m4,5) and different combinations of labeled nucleotide (indicated by an asterisk) and unlabeled nucleotide. The positions of the first round and higher order products are indicated by brackets. The total concentration of the labeled nucleotide was 0.2 µM (lanes 1 and 4), 1.2 µM (lanes 2 and 5) and 3.2 µM (lanes 3 and 6). (B) The processivity of telomerase at the P + 7 position as a function of dGTP and dTTP concentration is plotted. (C) The processivity of telomerase at the P + 7 position for the TEL15 and TEL15(m4,5) was determined in assays containing 3.2 µM dGTP and 50 µM dTTP and plotted.

