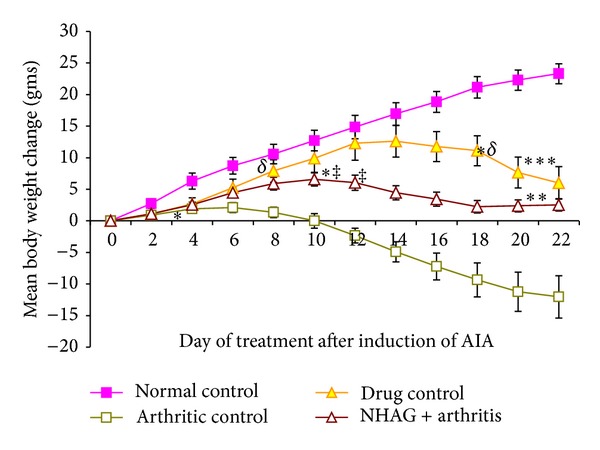
Figure 4.

Mean body weight change over a period of 22 days after arthritis induction. Each valuerepresents the mean ± SEM of n = 12 per group. A gradual increase in the body weight of normal control group was observed throughout the course of 22-day experiment. The arthritic control group demonstrated a significant decrease in their body weight from day 4 (*P < 0.01) onward. When compared to normal control, the indomethacin- and NHAG-treated arthritic group showed a decline in their body weight from days 14 and 12, achieved significance on day 18 (∗δ P < 0.04) and 12 (∗‡ P < 0.04), respectively. However, the reduction was significantly lower when compared to the arthritic control group on day 8 (δ P < 0.008) and day 12 (‡ P < 0.03) and continued till end of experiment (**P < 0.04) and (***P < 0.004) for indomethacin- and NHAG-treated groups, resp.).
