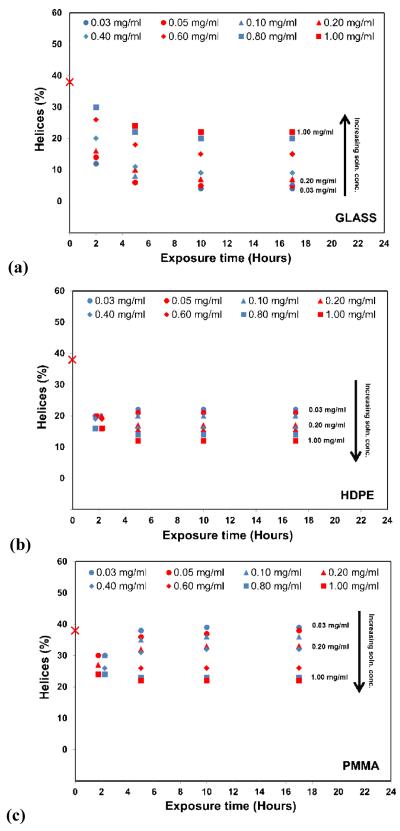
Figure 2.
Helical content of adsorbed HEWL on (a) glass, (b) HDPE, and (c) PMMA surface as a function of exposure time. Symbols represent the different protein solution concentrations that were used to adsorb the HEWL to each surface. Zero time point represents the native helical structure of HEWL in solution, which was 38% (± 2%), consistent with the reported secondary structure [30]. (N = 3, averaged 95% C.I. values = ±4 % helicity for each data point). Data points for the 2 h time point for (b) and (c) have been shifted slightly for visualization due to overlap. The black arrows indicate the direction of increasing solution concentration from which the protein was adsorbed. (see Table S.4. of the supporting information for the raw data in Fig. 2.)

