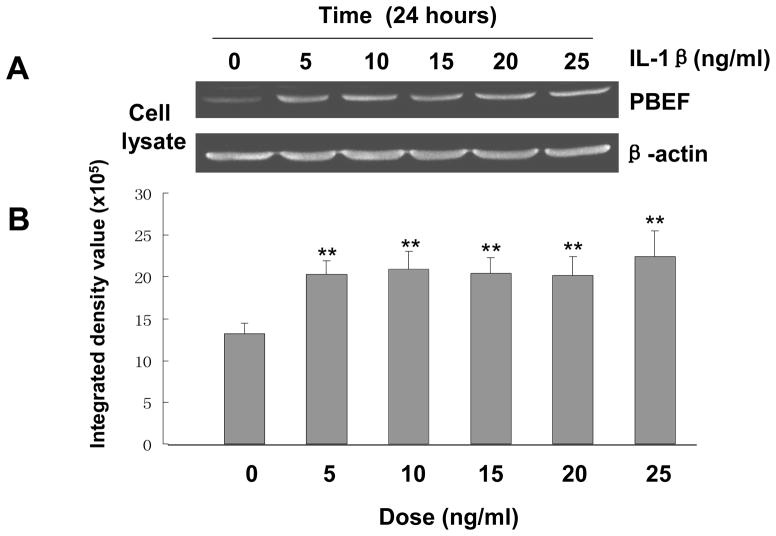
Fig. 1.
Dose-response of IL-1β induced PBEF protein expression in A549 cells. A. A representative western blotting image of PBEF and β-actin protein detections. After starving for serum overnight, A549 cells were stimulated with different doses of IL-1β, as indicated, for 24 hours. Equal amount of total cell lysate protein from each sample was separated by 16.5% SDS-PAGE and immunodetected by western blotting using anti-human PBEF or β-actin antibodies. Protein band images on the western blotting were acquired using the Alpha Imager (Alpha Innotech Corp., San Leandro, CA). The displayed image is one of three replicate samples and is typical of those obtained. B. Quantitation of cell lysate PBEF protein level by densitometry analysis. The protein band intensity on the western blotting was analyzed by the AlphaEase Stand Alone software (Alpha Innotech Corp., San Leandro, CA). The integrated density value of each band was used as a measure of the protein level. Results from each group are presented as mean ± SD of 3 samples. Statistical comparative analyses of PBEF levels between the control (IL-1β, 0 ng/ml) and different treatment groups (IL-1β, 5–25 ng/ml) were performed using the unpaired t test. **, p<0.01.

