Fig. 2.

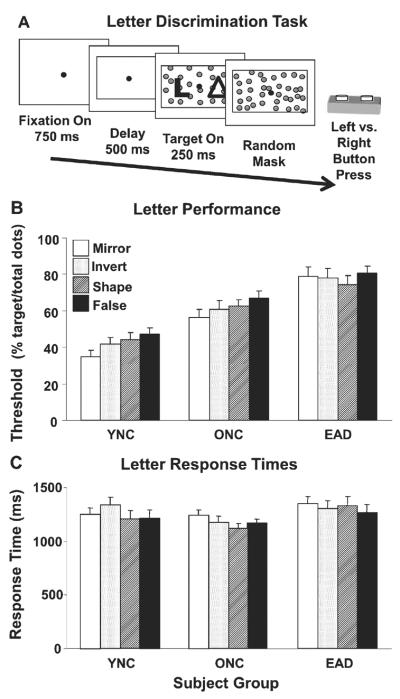
Letter discrimination assessed using stationary clutter coherence thresholds. A) The letter discrimination task consisted of a random sequence of paired figures, each pair consisting of a letter and one of four types of non-letter. Subjects pressed the left or right button corresponding to the side that contained the letter. The letters and non-letters were composed of dots, here shown as solid figures for clarity. All stimuli were presented with a varying number of superimposed randomly positioned noise dots to obtain letter discrimination thresholds. B) Letter discrimination thresholds for each subject group with each of the four types of non-letter stimuli. Group thresholds (mean±sem) are given as the percentage of all dots in the stimulus (target plus noise) that must form the target figures for the subjects to achieve 82.5% correct responses. The thresholds for YNCs are significantly lower than ONCs, which are significantly lower than EADs. C) Response time of subject groups (mean±se) for the four types of non-letter stimuli. Response times for YNCs and ONCs are not significantly different from each other, but both are significantly faster than EADs.
