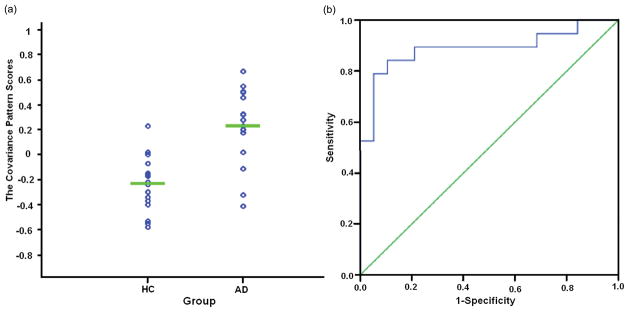
Figure 1.

The statistical results based on AD-associated covariance pattern scores in Group 1. (a) The scatterplot of covariance pattern scores. The covariance pattern scores were calculated from the linear combination of the four significant principal components in 19 AD patients and 19 HC. The expression of covariance patterns was significantly higher in AD patients than in the HC group. (b) ROC curve of discriminability from the expression of covariance patterns.
