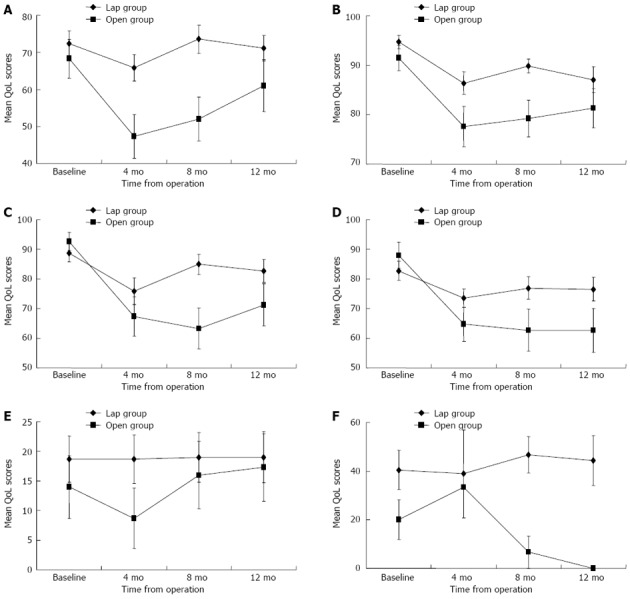
Figure 1.

Longitudinal assessment of changes in quality of life scores over time for global quality of life and various functional scales. A: Global health status/quality of life (QoL); B: Physical functioning; C: Role functioning; D: Social functioning; E: Sexual functioning; F: Sexual enjoyment (only for men who have been sexually active). A higher score indicates better functioning. Error bars indicate the standard error of the mean. The Friedman test was not performed for sexual enjoyment, as the number of patients changed at different time points.
