Figure 1.

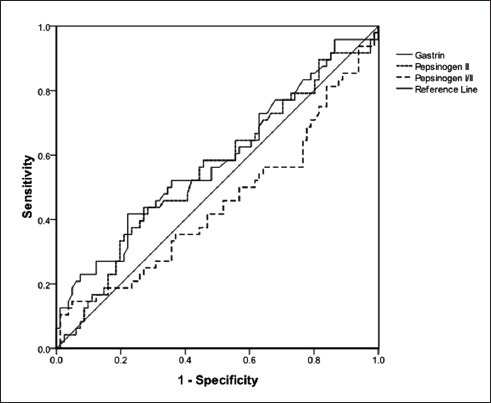
Receiver operating characteristic curves generated with gastrin 17 (line), pepsinogen II (upper dashed line), and pepsinogen I/II ratio (lower dashed line) for detecting gastric atrophy in dyspeptic patients

Receiver operating characteristic curves generated with gastrin 17 (line), pepsinogen II (upper dashed line), and pepsinogen I/II ratio (lower dashed line) for detecting gastric atrophy in dyspeptic patients