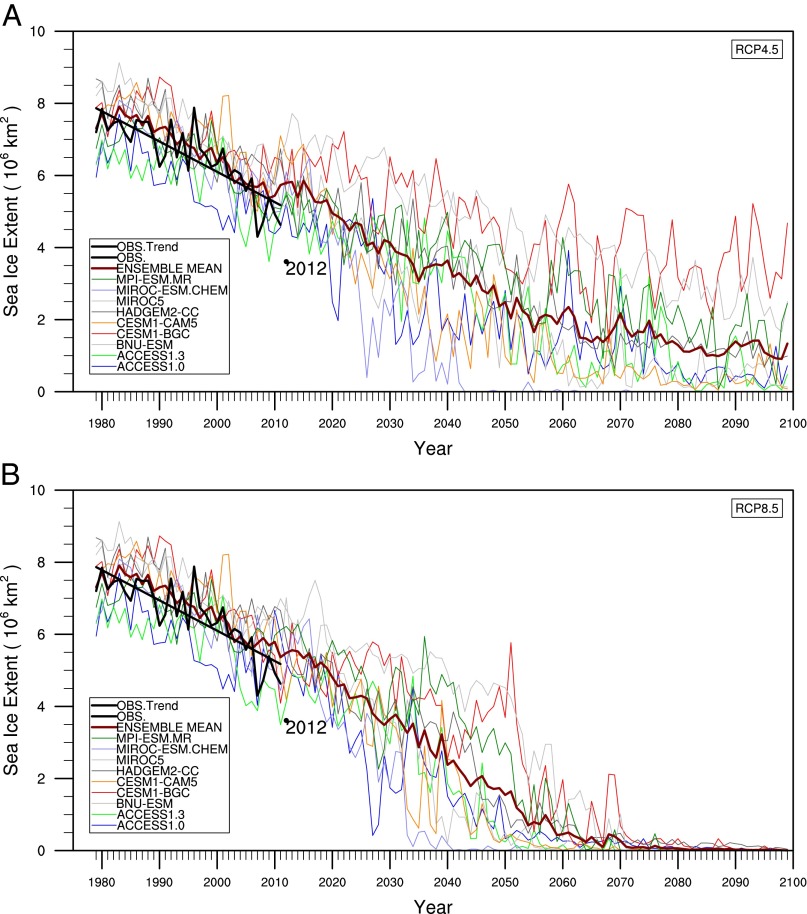
Fig. 3.
Time-series of the simulated (colored lines) September sea ice extent from 1979 to 2100 for the nine selected models under the (A) RCP4.5 and (B) RCP8.5. The thick black line is the observations, the thick red line is the ensemble mean of the nine models, and the black circle is September sea ice extent in 2012.

