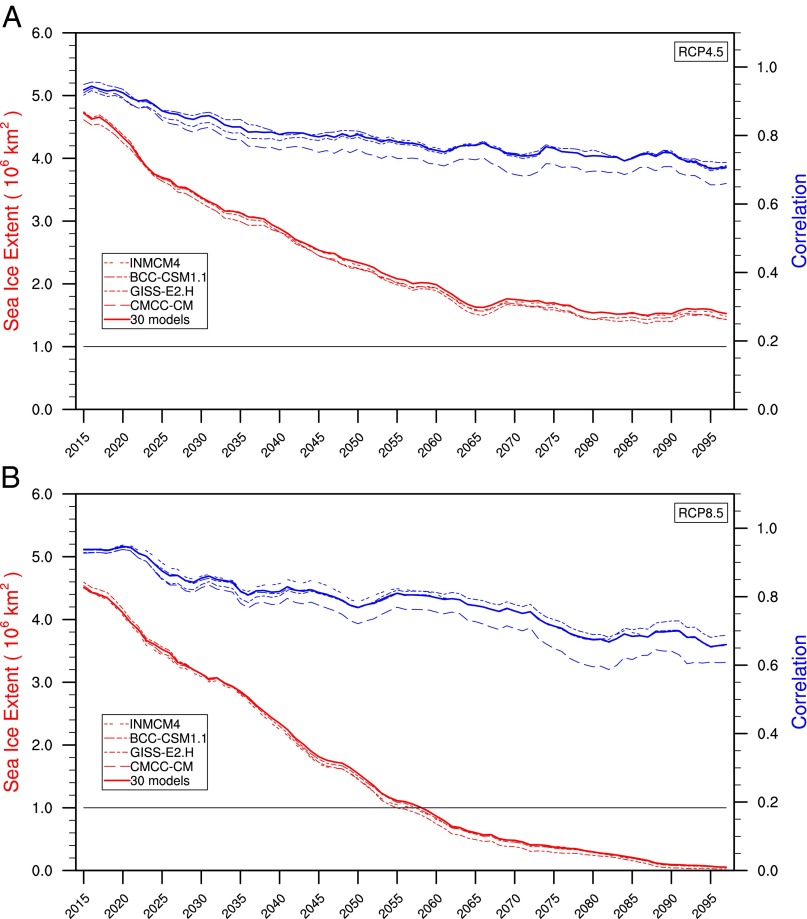
Fig. 5.
The evolution of the correlation (blue lines) and constrained estimation of September sea ice extent (red lines) based on the relationship between the simulated September sea ice extent averaged for 2007–2011 and the projected September sea ice extent averaged for the 5-y sliding windows under the (A) RCP4.5 and (B) RCP8.5.

