Fig. 3.
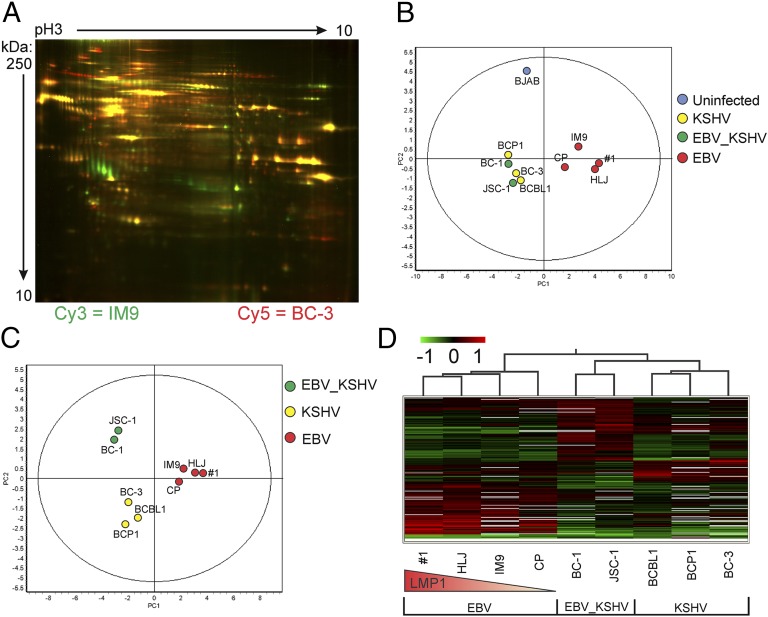
2D DIGE and Decyder analysis of B-cell exosome proteomes. Exosomal proteins were labeled with fluorescent dyes and separated by 2D DIGE in pH 3–10 immobilized gradients and SDS 12.5% polyacrylamide gels. (A) Representative gel shown (1 of 10) with IM9 exosome proteins labeled with Cy3 (green) and BC-3 exosome proteins labeled with Cy5 (red). PCA was performed on the 2D DIGE data and plotted based on (B) LMP1 expression or (C) viral groups. (D) Hierarchical cluster analysis of significantly (P ≤ 0.05, ANOVA) altered exosome components grouped by viral infection status. Red lines represent proteins whose expression levels were up-regulated relative to the group, green lines represent down-regulated proteins, and black lines represent unchanged proteins. The red triangle depicts relative LMP1 expression in the EBV cell lines.

