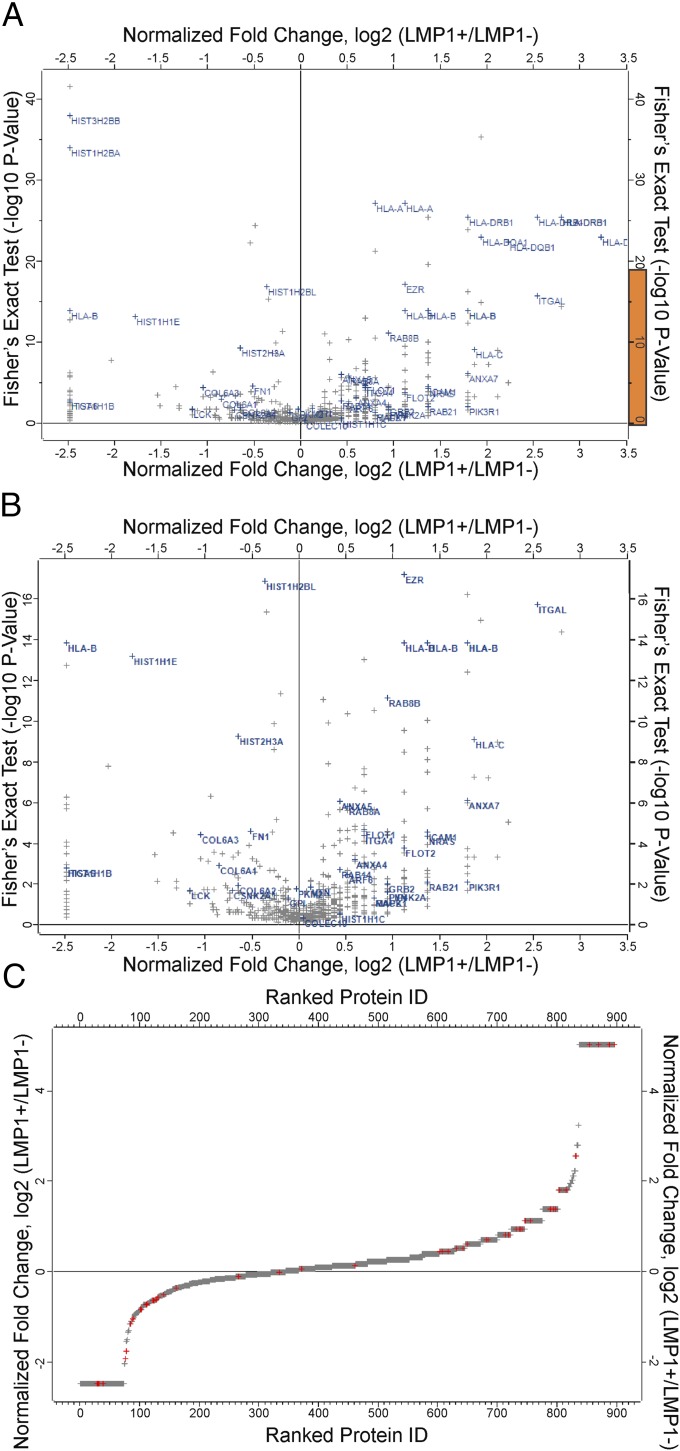
Fig. 5.
Label-free spectral count-based quantitative proteomic analysis. (A) Volcano plot showing normalized differences in protein expression in LMP1+ and LMP1− B-cell lines infected with EBV, KSHV, or EBV+KSHV. Note that the ANOVA P value of 0.05 (−log10 = 1.3) is used to identify significant differences in protein expression. (B) Enlarged view of the region highlighted in orange in A. (C) Overall differences in protein expression in LMP1+ and LMP1− B-cell lines ranked by protein ID. (Insets) Number of down-regulated and up-regulated proteins that show a log2 twofold change in the LMP1+/LMP1− ratio. Points marked in red represent proteins highlighted in A and B. Infinity units were given arbitrary values of log2 5 and −2.5.

