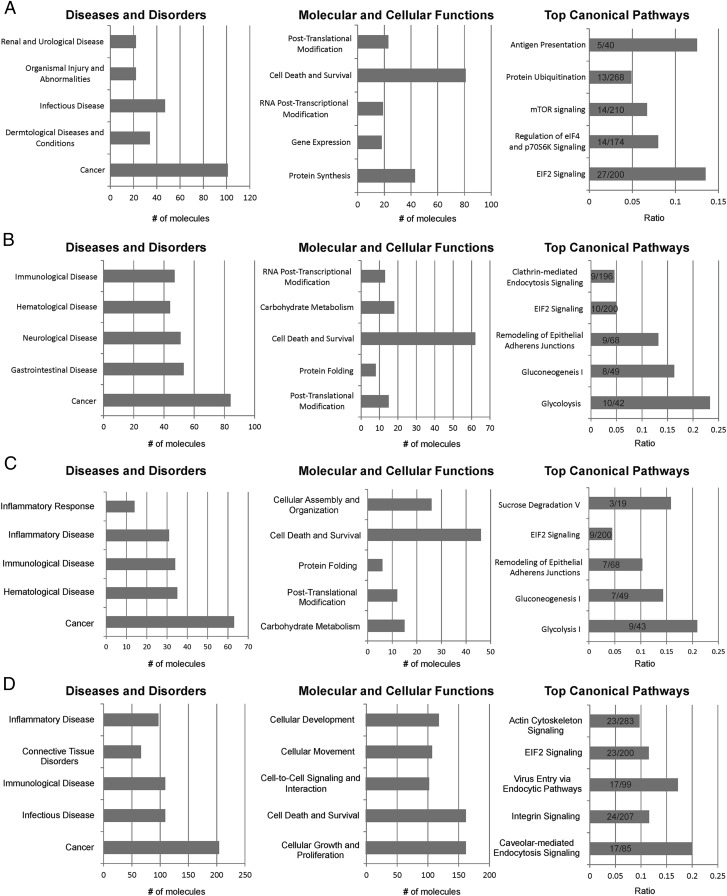
Fig. 6.
IPA of virally modified exosome components. IPA of (A) proteins only identified within EBV and KSHV exosomes compared to the BJAB control, (B) genes significantly altered by KSHV and KSHV/EBV relative to BJAB, (C) genes significantly altered by KSHV relative to BJAB, and (D) genes significantly changed when grouped by LMP1 expression. The graphs for the top Diseases and Disorders (Left) and Molecular and Cellular Functions (Center) categories show the total number of molecules identified by mass spectrometry that fall into the designated Ingenuity classification. The Top Canonical Pathways graphs (Right) represent the ratio of the number of molecules identified in this study to the total number of proteins in each Ingenuity pathway.

