
Fig. 3.

Gating modes of the networks determined by the oscillations frequency. (A) Erasing probability (dashed line) and blocking probability (continuous lines). Red stars correspond to the values of the oscillation in Fig. 2B and black triangles to the value in Fig. 2C. (B) Probability of the gating modes determined by the joint probability: of erase and block ( , red line), not-erase and not-block (
 , green curve), and not-erase and block (
 , yellow curve). The gate-out mode corresponds to domination of
  and falls in the range 8.5 Hz
  Hz with maximal value at
  (red star). The gate-in mode corresponds to the dominance of
  and falls in the range
  . The selective-gating mode corresponds to the dominance of
  and falls in the range 4.5 Hz
 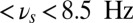 , with maximal value at
  (black triangle). The filled space around the curves represent SEM.