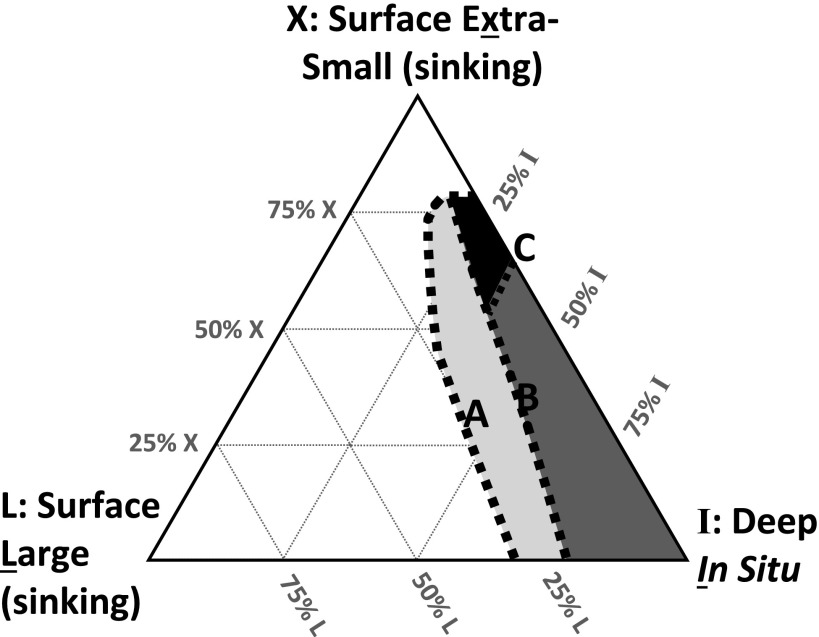
Fig. 3.
Ternary diagram showing modeled origin of mesopelagic (670 m) fatty acids as a mixture of three end members: sinking POM from the submicron (0.2–0.5 μm) X-POM size class (X) in the surface ocean (21 m), sinking POM from the larger (>0.5 μm) size class (L) in the surface ocean (21 m), and POM produced in situ (I) in the mesopelagic ocean (670 m). The shaded regions represent the solution spaces determined by models based on lipid profiles and compound-specific natural 13C and 14C content. The area with light shading defines the solution space allowed by a mixing model based on fatty acid chromatograms only; the boundaries of this space (A) are equivalent to line A in Fig. S5. The region with dark shading includes a constraint on the upper limit for the contribution from large surface particles, based on the 13C content of fatty acids; the boundary of this upper limit (B) is equivalent to line B in Fig. S5. The solid area is constrained further by the 14C content of mesopelagic DNA (31) and fatty acids; the boundary of this space (C) is equivalent to line C in Fig. S5.

