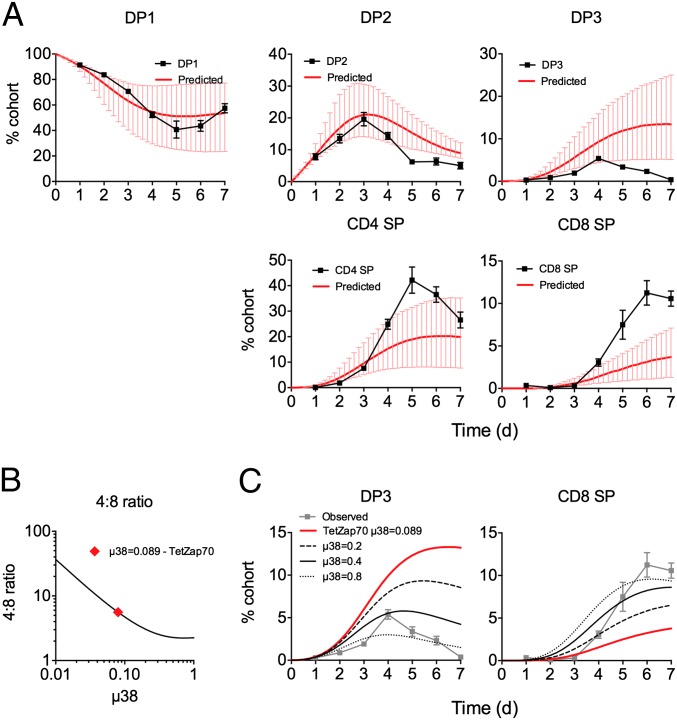
Fig. 4.
TetZap70 model parameter values predict behavior of WT thymocytes. Purified WT DP1 thymocytes were injected intrathymically into WT CD45.1 hosts (n = 36). At different days after transfer, groups of mice were taken (n = 4–7) and the phenotype of the donor population was determined by fluorescence-activated cell sorting. (A) Line graphs show the representation of each indicated subpopulation with time in the donor cellular cohort ±SD. Using the frequency of the DP1 subset as input, model parameters estimated from time courses of TetZap70 development in control chimeras (Figs. 2 and 3) were used to estimate the changing representation of each subset. Red lines indicate this predicted time course. Error bars indicate 95% CIs of model predictions. (B) Line graph is of a 4:8 ratio vs. µ38 predicted by the model keeping all other parameters constant. The red diamond indicates the value of µ38 originally estimated from TetZap70 thymic development data. (C) Line graphs show the observed (gray symbols) and predicted (red lines) time courses of intrathymically injected WT DP1 thymocytes from A. Additional black lines are model predictions made using the indicated µ38 parameter values instead.

