
Fig. 3.
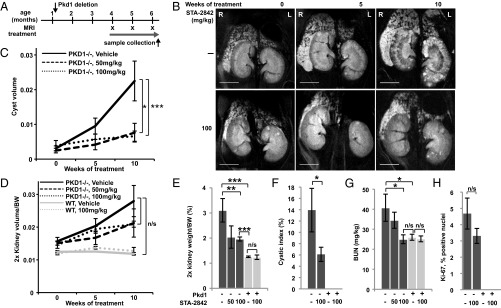
STA-2842 effectively inhibits progression of later stages of cystogenesis and renal growth in Pkd1−/− mice. (A) Schedule of dosing and MRI observation of Pkd1−/− and control mice. (B) Representative MRI images of drug- or vehicle-treated Pkd1−/− mice at the indicated time points (see also Fig. S6 A and B). (Scale bar, 0.5 cm.) (C and D) Quantification of cyst volume (C) and ratio of kidney volume in cubic centimeters to body weight in grams (D), based on MRI imaging. (E) Effect of STA-2842 on kidney: body weight ratio. (F) Cystic index of 100 mg/kg STA-2842 treated mice compared with control mice. (G) Effect of STA-2842 on BUN in Pkd1−/− and control mice. n = 5 for WT mice and n = 6–8 for Pkd1−/− mice (with the only exception that only 3 out of 5 WT mice were used to assess kidney volume based on MRI). (H) Representative kidney sections of Pkd1−/− and control mice treated with 100 mg/kg STA-2842 versus vehicle were stained for Ki-67 (see also Fig. S6C) and quantified. n = 2 WT mice and n = 7 Pkd1−/− mice. *P ≤ 0.05, **P ≤ 0.01, ***P ≤ 0.005, n/s, not significant. Data are expressed as mean +/− SEM.