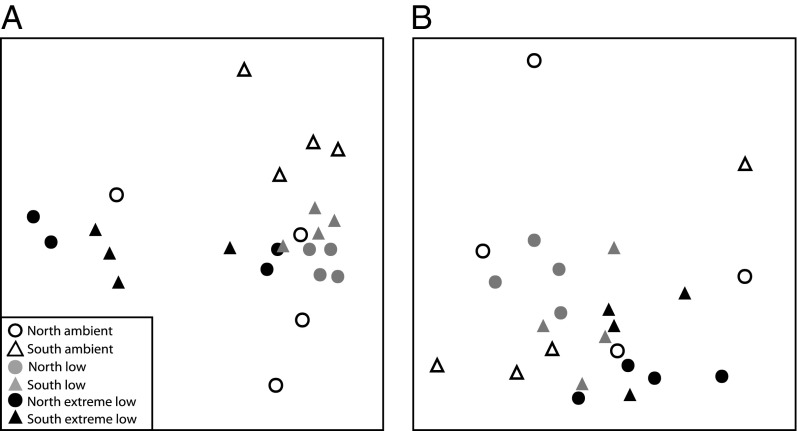
Fig. 3.
nMDS plots highlighting variation in (A) community structure and (B) patterns of recovery. Distance between points represents differences in (A) the assemblages at 32 mo postdisturbance and (B) the patterns of change through time for each plot for the entire recovery period. Fig. 3B represents differences in the correlation structure between time points for a single plot that are independent of the identity of taxa (i.e., whether recovery itself was similar or variable among plots). Means ± SEM, n = 4.

