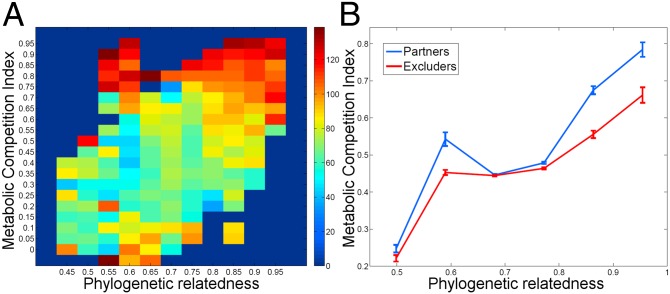
Fig. 3.
Habitat filtering in the gut microbiome across varying phylogenetic distances. (A) Heat map of ranked co-occurrence score, binned by phylogenetic distance (x axis) and metabolic competition index (y axis). The color of each bin represents the mean co-occurrence of all pairwise associations within it. Evidently, even among species pairs with a given phylogenetic relatedness, mean co-occurrence tends to increase with metabolic competition (red regions at the top of the heat map). (B) Average metabolic competition index and SE of partners and excluders vs. phylogenetic relatedness. At any level of phylogenetic relatedness, species have more similar nutritional profiles (significantly higher metabolic competition index) with partners than with excluders (P < 0.05 in all bins, one-tailed Mann–Whitney U test; see also Table S3E).

