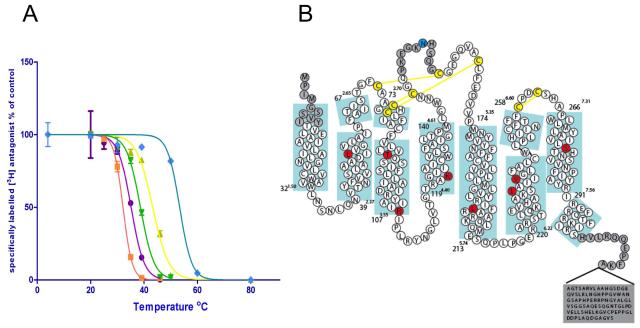
Figure 1.
(a) Thermostability plots of the wild type adenosine A2A receptor (purple circles), A2A-T4L (orange squares), A2A-StaR1 (previously Rant21, yellow triangles), A2A-T4L engineered to include the A2A-StaR1 mutations in combination with the T4L fusion (A54L2.52/T88A3.36/K122A4.43/V239A6.41) (green triangles) and vs A2A–StaR2 (blue diamonds). Error bars are derived from standard deviation and calculated from duplicated temperature points (n=2) within a single experiment (b) Sequence of the wild-type A2A receptor in relation to the secondary structure determined from the structure of A2A-StaR2. Thermostabilising residues are shown in red circles and the glycosylation site mutation N154A in blue. Disulphide bonds are in yellow. Numbers refer to the first and last residue in each TM (blue boxes) with the Ballesteros-Weinstein numbering in superscript (same for all subsequent figures).

