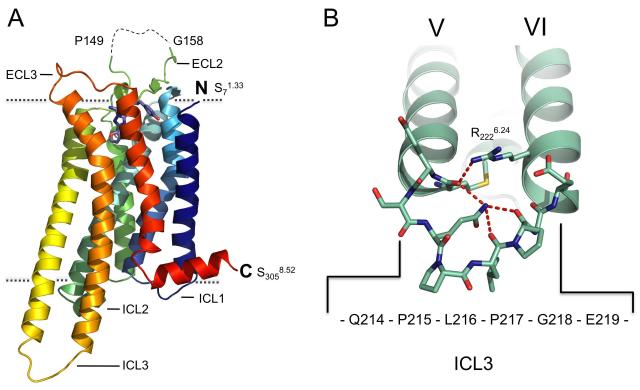
Figure 3. Overall Structure of the Adenosine A2A Receptor.
(a) Structure of A2A-StaR2-ZM241385 in rainbow colouration (blue to red) from the N-terminus to the C-terminus, ZM241385 is represented as a stick model (blue), oxygen atoms are red and nitrogen atoms deep blue. The visible extracellular and intracellular loops are labelled. The disordered portion of ECL2 is shown as a dashed line. Dotted lines denote approximate boundaries of the plasma membrane (b) TM5 and TM6 of the A2A-StaR2 (pale green) with ICL3 represented as a stick model. The potential H-bonding network connecting the two TM helices is shown (dashed red lines) involving Arg2226.24/Met2115.72/Gln214/Pro217. See also Figure S1. Individual TMs are numbered using Roman numerals and in all figures forthwith.

