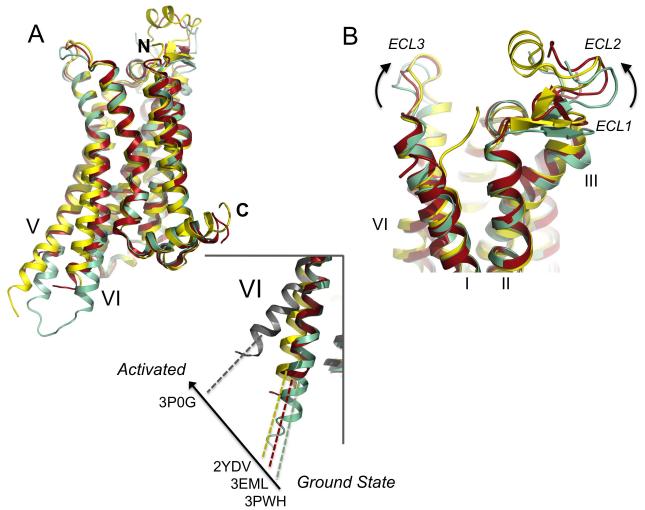
Figure 8. Comparison of the conformations of different A2A receptor structures.
(a) Superposition of the A2A-StaR2-ZM241385 (pale green) (PDB code: 3PWH), A2A-T4L-ZM241385 (dark red) (PDB code: 3EML), A2AR-GL31 (yellow) (PDB code: 2YDV) and agonist-β2AR Nb80 (grey) (PDB code: 3P0G) structures in cartoon representation, ligands have been omitted. The N and C-termini are marked, and TM5 and 6 are labelled. (inset) close up view of TM6 illustrating the degree of helix rotation from the ground state (3PWH) to R* (3P0G). 3EML and 2YDV sit at intermediate points on the activation pathway. (b) Superposition of the A2AR structures, coloured and represented as in (a), close-up view of the extracellular side of the receptor, demonstrating the conformational changes occurring in ECL1 and 2 upon activation.

