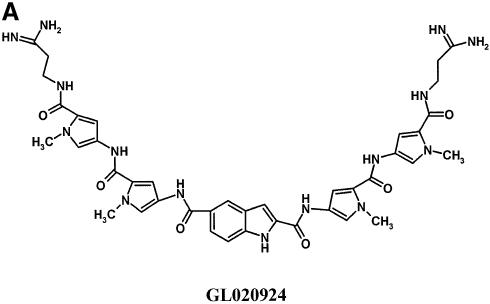
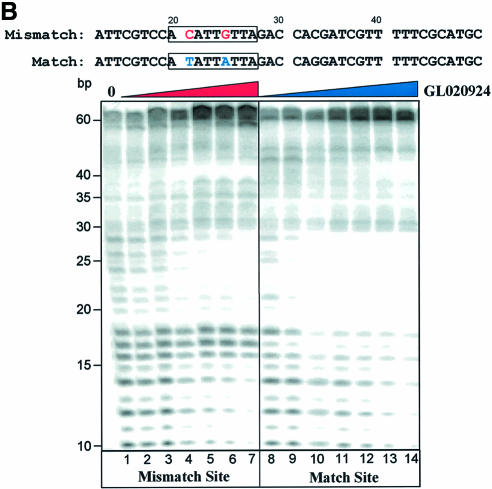
Figure 4.
Characterization of GL020924 DNA binding by DNase I footprinting. (A) Structure of GL020924. (B) Labeled oligonucleotides, each containing a GL020924 match or mismatch site (boxed area), were incubated with increasing amounts of GL020924 and partially digested with DNase I. Digestion products were separated on a 10% sequencing gel, and results were visualized and quantitated with a PhosphorImager. Compound concentrations were 0, 50, 150, 300, 450, 600 and 750 nM for the mismatch oligonucleotide (lanes 1–7), and 25, 50, 150, 300, 450, 600 and 750 nM for the match oligonucleotide (lanes 8–14).


