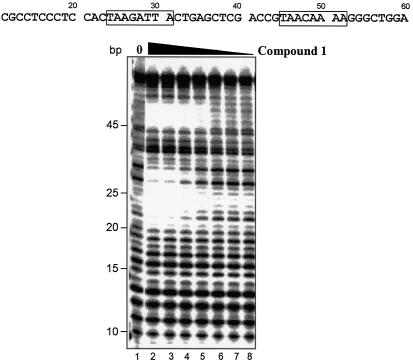
Figure 7.
Characterization of compound 1 DNA binding by DNase I footprinting. Labeled oligonucleotide containing two compound 1 match sites (boxed areas) was incubated with increasing amounts of compound 1, and was partially digested with DNase I and analyzed as described in the legend to Figure 4B. Compound concentrations were 0, 300, 200, 100, 50, 25, 12.5 and 5 nM (lanes 1–8).

