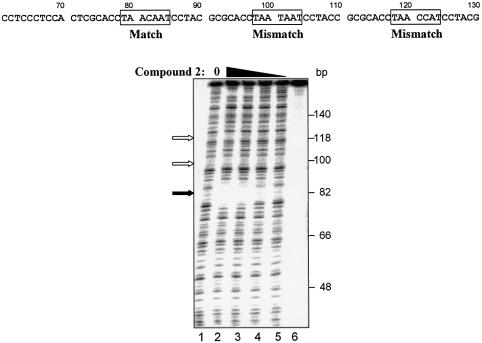
Figure 9.
Characterization of compound 2 DNA binding by DNase I footprinting. Labeled oligonucleotide containing one match site and two mismatch sites to compound 2 (boxed areas) was incubated with increasing amounts of the compound, and was partially digested with DNase I and analyzed as described in the legend to Figure 4B. Compound concentrations were 270, 90, 30 and 10 nM (lanes 2–5). No compound control is shown in lane 1. No compound, no DNase I control is shown in lane 6. The protected match site is shown by the filled arrow and the positions of the mismatch sites are indicated by the open arrows.

