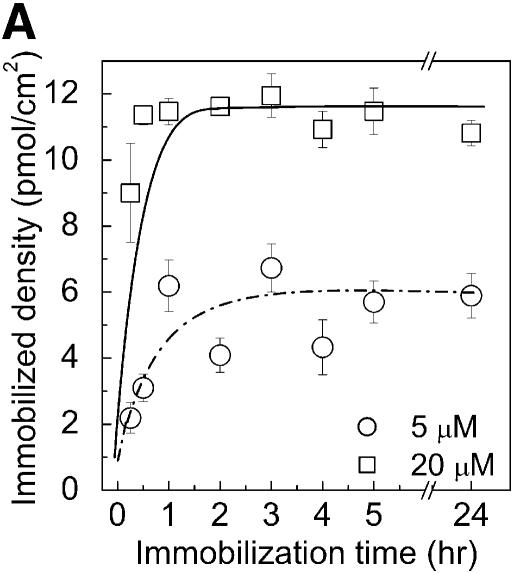
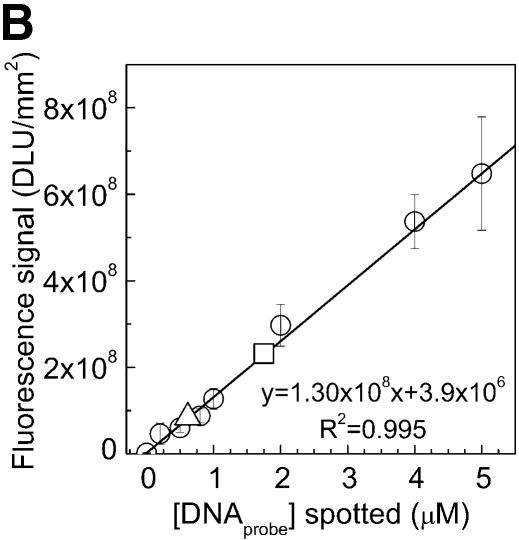
Figure 2.
Immobilization kinetics of oligonucleotides onto chemically modified PMMA substrate (according to the protocol in Fig. 1A) using different probe concentrations and immobilization times (A). NH2-DNA oligo-probes were immobilized at concentrations of 5 and 20 µM. The density of immobilized DNA probes was obtained by scanning the surface after immobilization and reading the output fluorescent signal from each spot, and converted into a molecular density using a standard curve (circles) (B). Fluorescent NH2-DNA oligo probes were spotted in 0, 0.2, 0.5, 0.8, 1, 2, 4 and 5 µM concentrations and scanned directly without washing. The fluorescent signals obtained for NH2-DNA oligo probes immobilized for 2 h at 5 and 20 µM concentrations [from (A)] are represented in (B) by triangles (5 µM) and squares (20 µM), respectively. Both the calibration curve and the immobilization quantifications were done using the same settings for the laser power and photo multiplier tube gain (see Materials and Methods).


