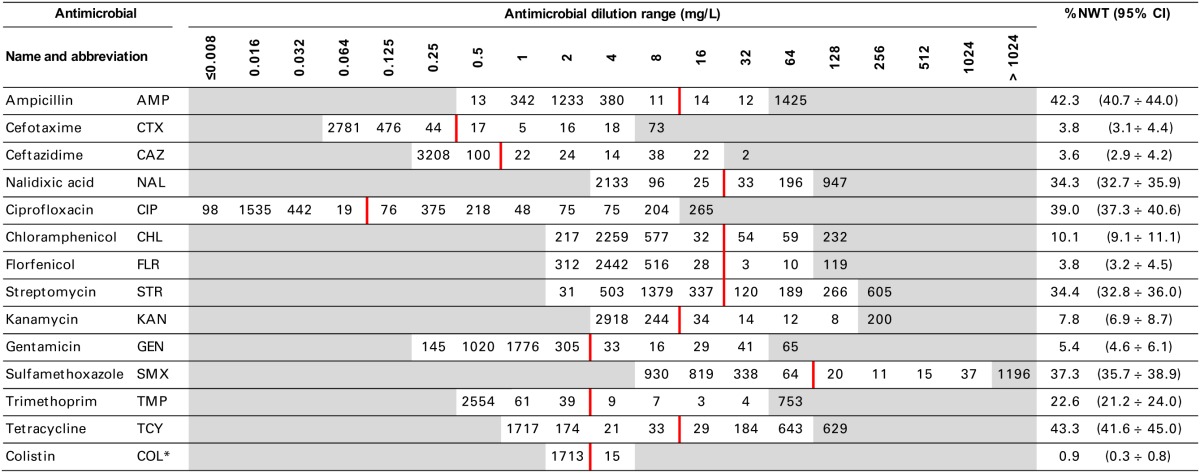
Table 2.
Minimal inhibitory concentration distribution of E. coli isolates (N = 3430).

White zones display the applied dilutions ranges. Vertical line indicates interpretative criteria (EUCAST epidemiological values).
*1728 isolates from 2011–12 were tested.
