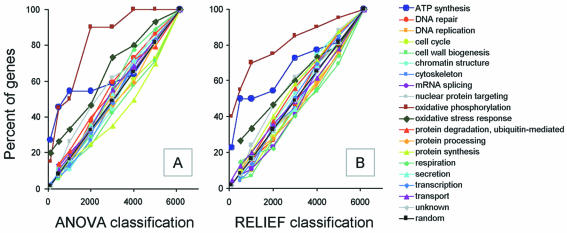
Figure 3.
Identification of the cellular processes affected. Genes were ranked by RELIEF (A) and by ANOVA (B) and grouped according to the cellular process involved. The ordinate corresponds to the percentage of genes involved in a given process with a rank below the value indicated on the abscissa.

