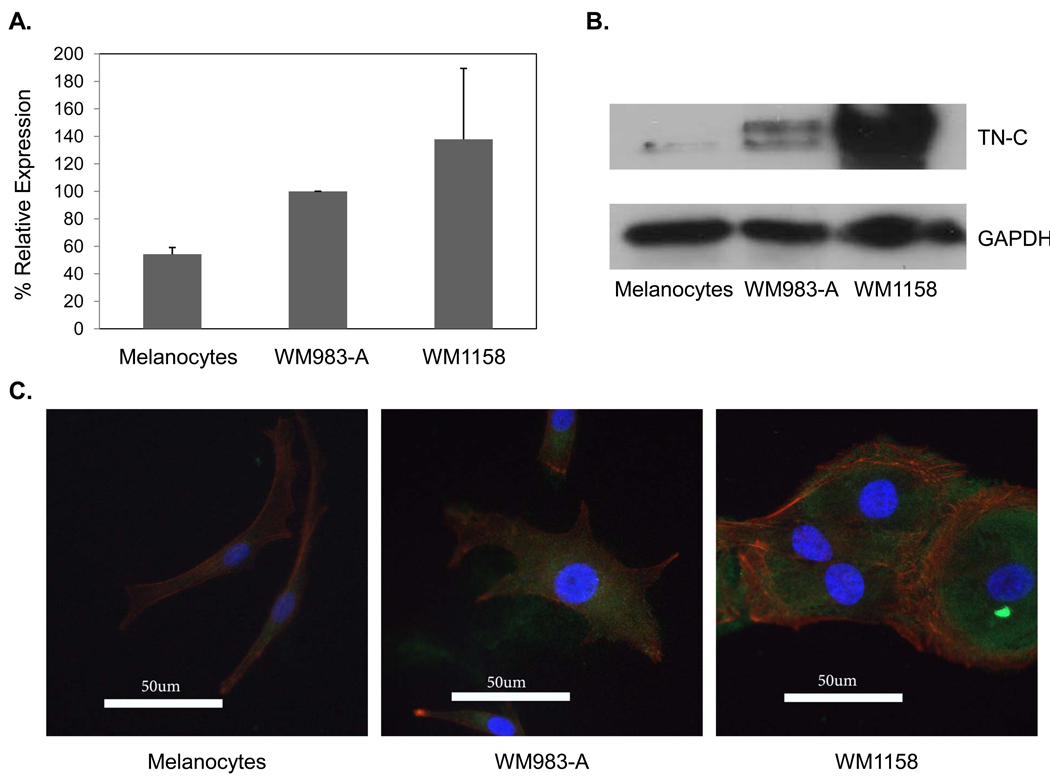
Figure 3. Expression of tenascin-C in melanoma cells.
A. Quantitative RT-PCR analysis of the expression of tenascin-C (TN-C) mRNA in WM983-A (VGP) and WM1158 (MGP) melanoma cells compared to human melanocytes, propagated in vitro. The data are expressed as the mean±standard deviation from three independent experiments. B. Immunoblot analysis depicting the level of TN-C in the VGP and MGP melanoma cell lines and melanocytes. C. Immunofluorescence analysis of melanocytes and VGP and MGP melanoma cell lines, probed with antibody to TN-C (pseudocolored green) and actin (pseudocolored red). The cells were counterstained with fluorescent DAPI (pseudocolored blue).

