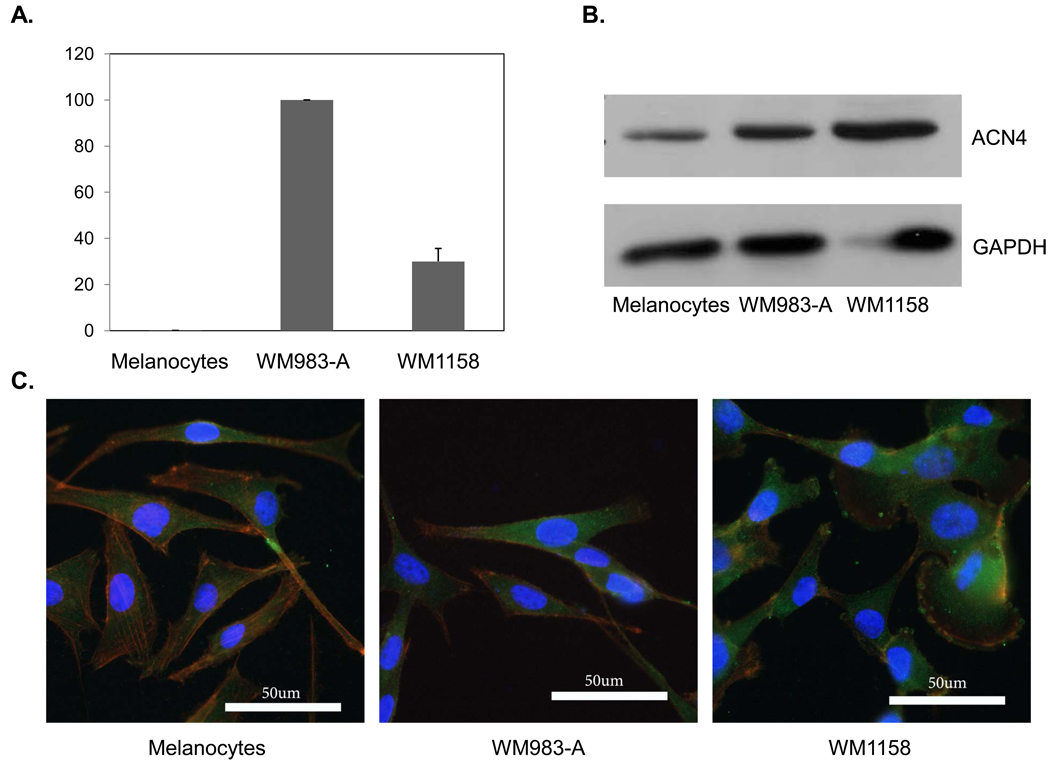
Figure 4. Alpha-actinin-4 expression melanoma cells.
A. Quantitative RT-PCR analysis of α-actinin-4 (ACN4) expression in the WM983-A (VGP) and WM1158 (MGP) melanoma cell lines and in melanocytes. The data are expressed as the mean ±standard deviation from three independent experiments. B. Immunoblot analysis of ACN4 expression in the VGP and MGP melanoma cell lines and in melanocytes. C. Immunofluorescence analysis of melanocytes and VGP and MGP melanoma cell lines, probed with antibody to ACN4 (pseudocolored green) and actin (pseudocolored red). The cells were counterstained with fluorescent DAPI (pseudocolored blue).

